Learning the Randomness – Attempt 1
Have you ever wondered how randomness work in computers ? Try the button to generate a random number :
Every time you click the button, you will randomly get a number. Isn’t it amazing that the computer, a deterministic object, can create these sequence of random numbers ? To me, this is a very interesting topic. Let me tell you something, actually what you see isn’t random. These sequences generated by using a function called pseudo-random generator.
Recently I was thinking about pseudo-random number generators. Pseudo-random number generators (prng) are functions that generate a sequence of numbers in a way that the sequence approximates randomness. The reason it is called pseudo is because the sequence is actually deterministic. If you know the starting point, you can get all the values in the coming sequence. This initial value is called the seed of the prng. So generated sequence completely depends on the value of the seed. To make a prng a true random generator, usually prng’s seed would get connected to a truly random event. For example the moment in micro seconds where a user presses the button generate. This event is totally random in terms of time, we can’t really know when the user will press. So if we were to use the moment in micro seconds as the seed of the prng, we would be able to get truly random number sequence, since the seed is randomized by a true random event.
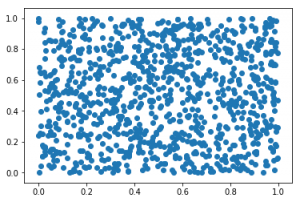
Let’s first look at how random is this generator in reality? What if we randomly sample 1000 x points and 1000 y points and plot (x,y) to see what we get :
import numpy as np
import tensorflow as tf
import time
import matplotlib.pyplot as plt

plt.scatter(rng.rand(1,1000),rng.rand(1,1000))
plt.show()

It looks pretty much random to me 🙂 So my idea is to somehow learn the randomness, but that plot basically shouts “I’m randooom. ” but still there must be something I can try, I thought. I decided to look into random seed. For a given random seed, generated random sequence is deterministic. Maybe I can generate some data, using different random seeds and generate the first random value generator will generate. If we can utilize this data to figure out the value prng will generate, we can pretty much solve the randomness.
So let’s get some data, shall we ?
datacount = 1000
seed_start = 0

trainx = []
trainy = []

for i in range(datacount):
    sdd = seed_start + i

    # set the seed for random generator
    np.random.seed(sdd)

    #generate a random number between 0-1
    rad = np.random.rand()

    trainx.append(sdd)
    trainy.append(rad)

# Divide data by half for testing and training
train_X = np.asarray(trainx[0:int(datacount/2)])
train_Y = np.asarray(trainy[0:int(datacount/2)])
test_X  = np.asarray(trainx[int(datacount/2):])
test_Y  = np.asarray(trainy[int(datacount/2):])

#Lets do some Standardization on X to scale it down
#otherwise x range is 0:1000 vs 0:1 in y

xmax = max(train_X)
stdx = np.std(train_X)

train_X = (train_X - xmax) / stdx

plt.scatter(train_X,train_Y)
plt.show()
By starting from 0 and incrementing it by 1 in each iteration, we created 1000 data points. For each point, we used X value as the seed value for the random generator and determined the y value from the first random value generated by the prng. Note that, every time you set the seed to a value, the first random value and consecutive ones are deterministic and dependent on that seed value.
So first intuition is to try a simple linear regression model. We have input value x corresponds to the output value y. It sounds like a direct definition of a linear regression. For this one and several coming Machine Learning related posts, I’ve decided to use Tensorflow library. If you don’t know it, you are probably at the wrong place 🙂 . Reason I will be using tensorflow is simple, I’m learning it. “Best way to learn something is to teach it.”
For the linear regression model, we will simply use these equations :
$latex y_{pred} = W*x + b$
$latex L = \frac{1}{m} * \sum_{i=1}^{m} (y_{actual_i} – y_{pred_i})^2 $
Classical linear regression model with a Mean Squared Error loss function. Here we will try to minimize this loss function to solve W and b. I can hear you are saying “But this can’t be enough to learn randomness!”. One variable definitely doesn’t have capacity to learn this randomness, but don’t forget every big project starts with smaller steps. So bear with me, slowly we will get there. Let’s first check linear regression code in tensorflow :
rng = np.random

learning_rate = 0.01
training_epochs = 2000
display_step = 10

n_samples = train_X.shape[0]

X = tf.placeholder("float")
Y = tf.placeholder("float")

W = tf.Variable(rng.randn()/100, name="weight")
b = tf.Variable(rng.randn()/100, name="bias")
pred = tf.add(tf.multiply(X, W), b)

# Mean squared error
cost = tf.reduce_sum(tf.pow(pred-Y, 2))/(2*n_samples)
optimizer = tf.train.GradientDescentOptimizer(learning_rate).minimize(cost)

# Initialize the variables (i.e. assign their default value)
init = tf.global_variables_initializer()

sess = tf.Session()
sess.run(init)

# Fit all training data
for epoch in range(training_epochs):
    for (x, y) in zip(train_X, train_Y):
        sess.run(optimizer, feed_dict={X: x, Y: y})

    # Display logs per epoch step
    if (epoch+1) % display_step == 0:
        c = sess.run(cost, feed_dict={X: train_X, Y:train_Y})
        print("Epoch:", '%04d' % (epoch+1), "cost=", "{:.9f}".format(c), \
            "W=", sess.run(W), "b=", sess.run(b))

print("Optimization Finished!")
training_cost = sess.run(cost, feed_dict={X: train_X, Y: train_Y})
print("Training cost=", training_cost, "W=", sess.run(W), "b=", sess.run(b), '\n')
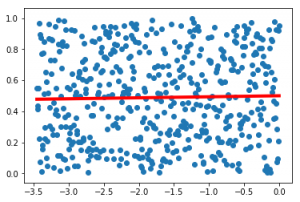
Pretty straightforward, initialize variables to be learned randomly. Train with gradient descent optimization, go over each sample in train set and train to minimize the MSE loss function. I haven’t trained it for a long time but I think it was enough for convergence. For reference my final result : “Training cost= 0.041403197 W= 0.0064280666 b= 0.49981427 “
Now, I think the learned function seems pretty obvious. But let’s check it on the input data :
y_res = sess.run(pred, feed_dict={X: train_X})

plt.scatter(train_X,train_Y)
plt.plot(train_X,y_res,linewidth=4, color='r')

plt.show()

Result is obvious, all of this random data could only be combined and represented with a line in the middle. So what else we can try to improve on this ? Maybe I can try multilayer fully connected network.
rng = np.random

learning_rate = 0.01
training_epochs = 200
display_step = 50

n_samples = train_X.shape[0]


X = tf.placeholder(tf.float32, [None, 1])
Y = tf.placeholder(tf.float32, [None, 1])

W1 = tf.Variable(rng.randn(1,16), name="weight1",dtype="float")
b1 = tf.Variable(rng.randn(16), name="bias1",dtype="float")

fc1 = tf.nn.relu(tf.matmul(X, W1) + b1)       #out1 = tf.add(tf.multiply(X, W1), b1)


W2 = tf.Variable(rng.randn(16,32), name="weight2",dtype="float")
b2 = tf.Variable(rng.randn(32), name="bias2",dtype="float")

fc2 = tf.nn.relu(tf.matmul(fc1, W2) + b2)

W3 = tf.Variable(rng.randn(32,1), name="weight3",dtype="float")
b3 = tf.Variable(rng.randn(1), name="bias3",dtype="float")

pred = tf.matmul(fc2, W3) + b3                  #pred = tf.nn.relu(tf.matmul(X, W1) + b1)


cost      = tf.reduce_sum(tf.pow(pred-Y, 2))/(2*n_samples)
optimizer = tf.train.GradientDescentOptimizer(learning_rate).minimize(cost)


init = tf.global_variables_initializer()
loss_history = []

sess = tf.Session()
sess.run(init)

# Fit all training data
for epoch in range(training_epochs):
    for (x, y) in zip(train_X, train_Y):
        sess.run(optimizer, feed_dict={X: x.reshape([1,1]), Y: y.reshape([1,1])})

    c = sess.run(cost, feed_dict={X: train_X.reshape([int(datacount/2),1]), Y:train_Y.reshape([int(datacount/2),1])})
    loss_history.append(c)


    # Display logs per epoch step
    if epoch % display_step == 0:
        print("Epoch:", '%04d' % (epoch+1), "cost=", "{:.9f}".format(c))

print("Optimization Finished!")
training_cost = sess.run(cost, feed_dict={X: train_X.reshape([int(datacount/2),1]), Y: train_Y.reshape([int(datacount/2),1])})
print("Training cost=", training_cost, '\n')


plt.plot(loss_history)
plt.show()

y_res = sess.run(pred, feed_dict={X: train_X.reshape([int(datacount/2),1])})

plt.scatter(train_X,train_Y)
plt.plot(train_X,y_res,linewidth=4, color='r')

plt.show()

y_res_test = sess.run(pred, feed_dict={X: test_X.reshape([int(datacount/2),1])})

plt.scatter(test_X,test_Y)
plt.plot(test_X,y_res_test,linewidth=4, color='r')

plt.show()

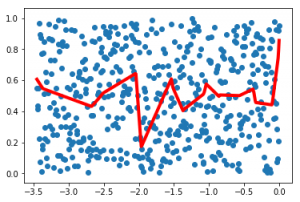
To be honest, I wouldn’t call this an improvement 🙂 But really, that is about as cool as I could get it. Data is obviously random and I can’t really see a pattern to learn by looking at the plot. But at least it shows how to use fully connected layers in tensorflow 🙂
But there is more ! Random numbers generated are a sequence which passes randomness tests. We just ignored this sequence relation and used each point as individual points. But in reality prng is a sequence generator that manages to look like random numbers. So next thing is to try to learn this sequence relation. I am looking forward to try some LSTM networks on this sequence relation, but it is another long topic to post; this post is already too long.
See you in another post. It is time to keep learning.
EDIT: You can find the notebook and source code version of the post here in my github : Learning Randomness – Attempt 1- GITHUB
Selam Yusuf abi, Tensorflow için önerebileceğin kapsamlı kaynak var mı?
Selam Berat, tensorflow için ben genelde kendi tutorial larını kullanıyorum ilk başlangıç için güzel örnekleri var. Tutorial sayfası : https://www.tensorflow.org/tutorials/ . Onun dışında deep learning’e genel bir giriş ve konseptleri öğrenmek için şu kursa bir göz atabilirsin : http://cs231n.stanford.edu/